Beyond the Poverty Line — Understanding the True Cost of Living
By Annie Elliott, Senior Data Analyst at Metopio, and Heather Blonsky, Vice President of Data at Metopio
Why the Federal Poverty Level Doesn't Tell the Whole Story
A public health director recently reached out to Metopio with a familiar concern: "I have elderly people in my community, and I know they're not making ends meet. We have housing cost burden data, but where can I find information that really captures what's happening?"
It's a question Annie Elliott, Senior Data Analyst, and Heather Blonsky, Vice President of Data at Metopio hear often. And it highlights a critical gap in how we measure economic hardship in America.
"A lot of people start with poverty, and that's a great place to start," Elliott explains. "But there's one federal poverty level for 48 states, and we know that the cost of childcare, and the cost of getting an apartment or buying a house are not the same across the U.S."
The federal poverty level treats economic hardship as uniform, when in reality, $50,000 means something very different in rural Arkansas than it does in coastal California or a Colorado ski town. Understanding the true cost of living requires going deeper.
What It Really Takes to Afford a Two-Bedroom Apartment
One of Metopio's most revealing indicators is the annual income needed to afford a two-bedroom apartment at fair market rent. Based on Housing and Urban Development (HUD) data, this metric shows just how much geographic variation exists, even within a single state.
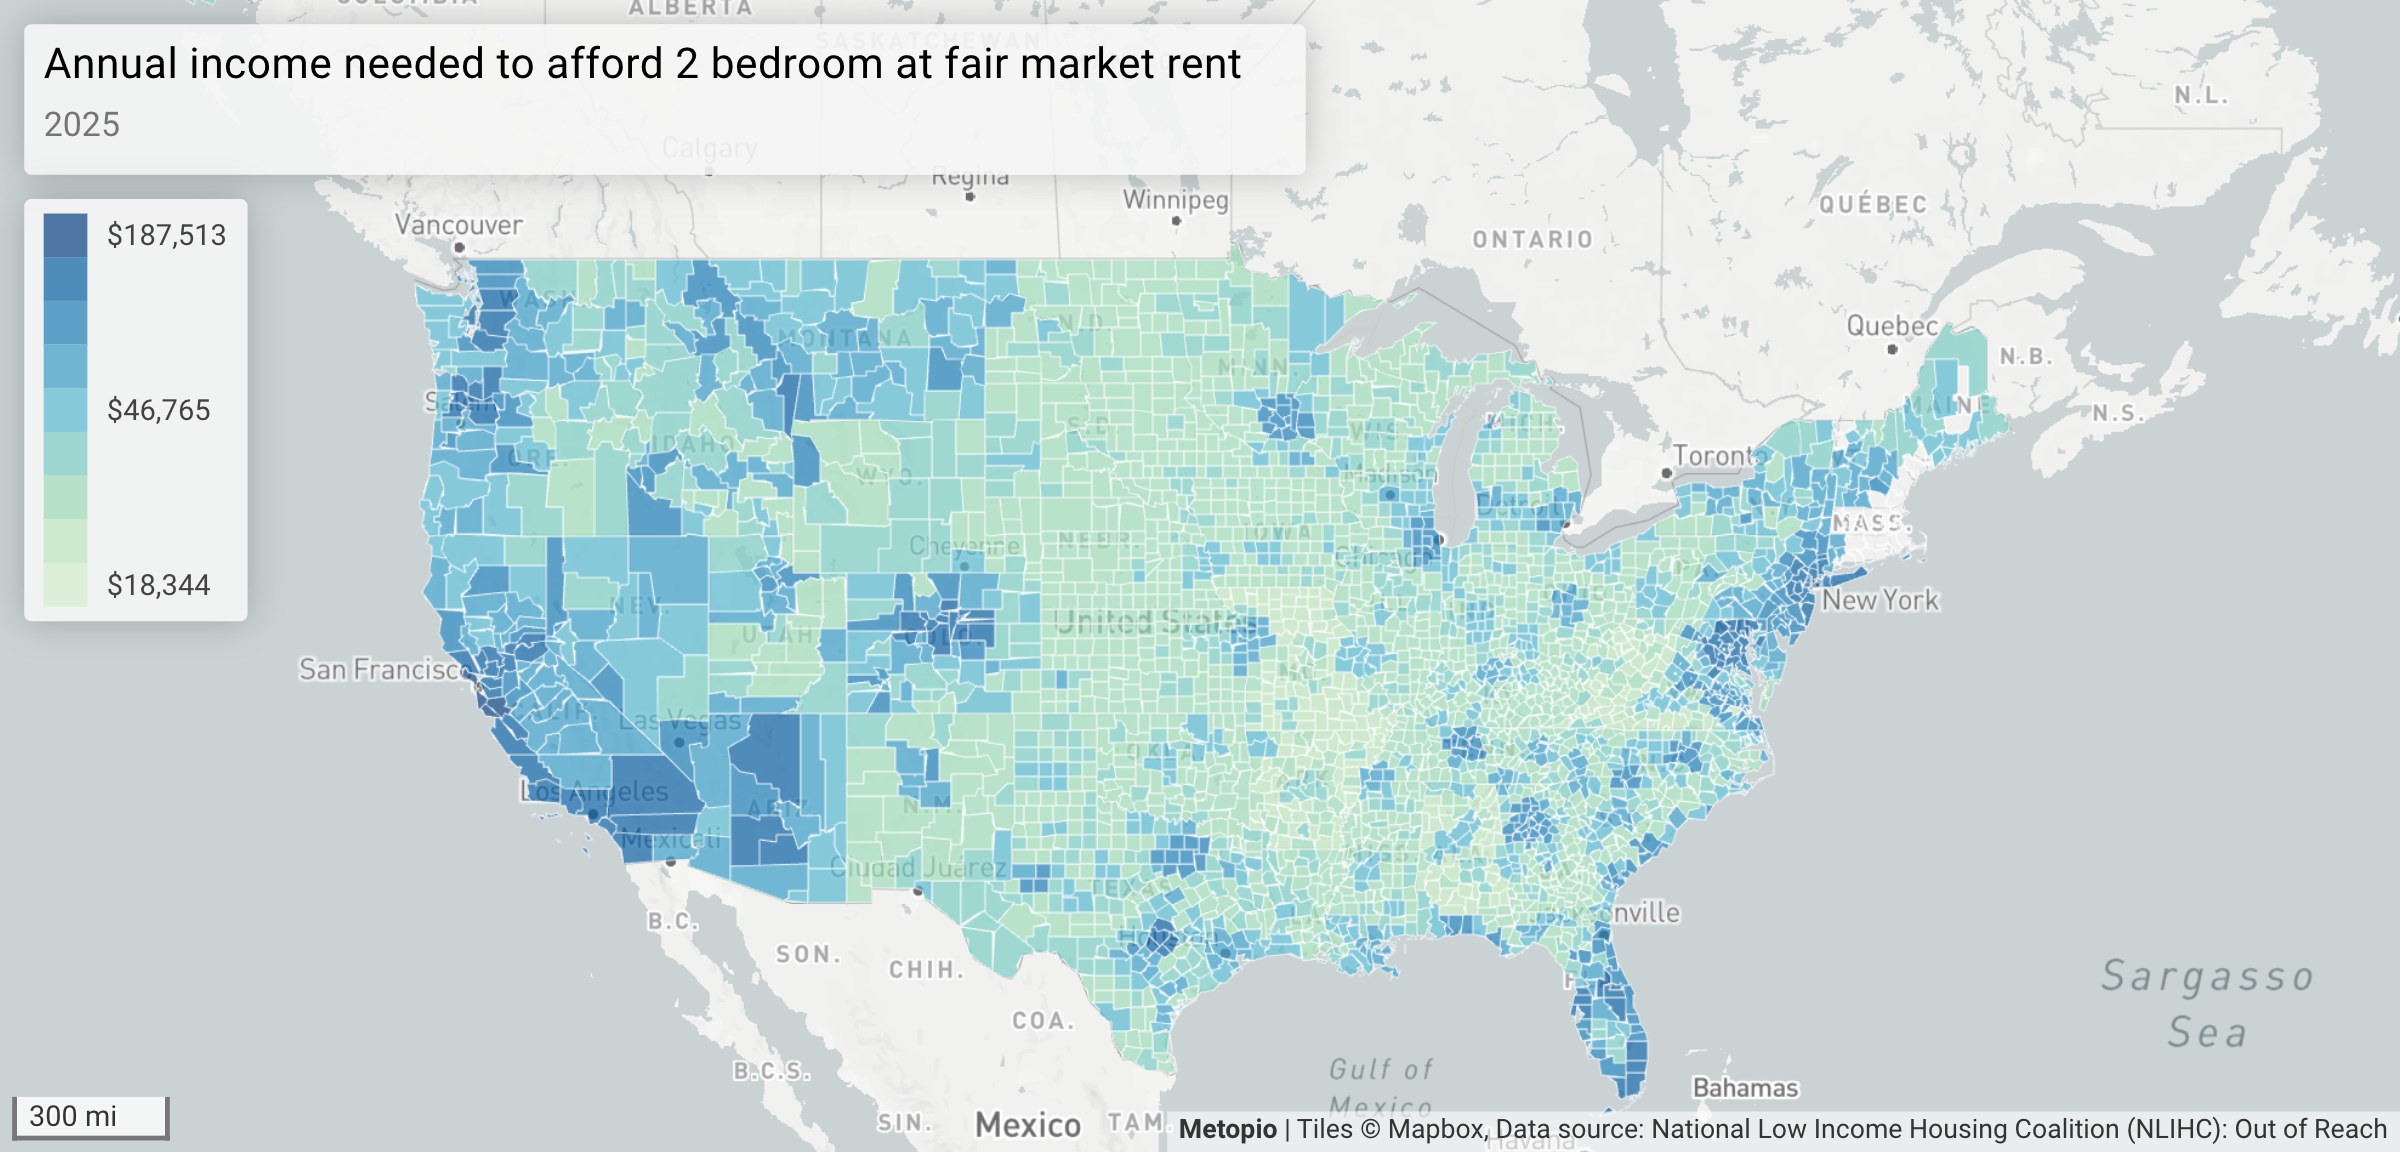
"If you've ever lived in different places across the country, you know what you get in Washington, D.C. versus Nebraska versus Detroit is all very different," says Blonsky. "In some places, that two-bedroom apartment costs more than a house in another location."
The map makes these disparities strikingly visible. For public health departments and hospitals working on Community Health Assessments, this data provides essential context for understanding economic stress in their service areas.
The Impossible Math of Minimum Wage
But income requirements are only half the equation. Metopio also tracks weekly minimum wage hours needed to afford that same two-bedroom apartment — and the numbers are sobering, up to 136 hours a week in one Texas county.
In Dallas County, the number climbs to 200 hours per week. Knowing that a full-time job is typically 40 hours per week, even two adults working full-time minimum wage jobs couldn't afford a modest two-bedroom apartment.
"You start to think about two people with a couple of children who need two bedrooms," Elliott explains. "If they're working minimum wage jobs, there's no possible way — even both of them working full-time."
However, some states are faring better due to a combination of higher minimum wages and lower housing costs. Arkansas, Missouri, Nebraska, and South Dakota show that two full-time minimum wage earners can afford fair market rent.
"That's not necessarily what you would have guessed," Blonsky observes. "But there it is — the combination of their minimum wage and the cost of rent makes it mostly doable."
This data shifts the conversation from individual responsibility to structural reality. When the math doesn't work, no amount of budgeting advice will solve the problem.
Childcare: The Hidden Budget Killer
Housing isn't the only major expense squeezing family budgets. Childcare cost burden — measured as a percentage of median income — reveals another critical pressure point.
In some counties, childcare consumes 35% to 40% of median household income, a threshold where families start making difficult calculations.
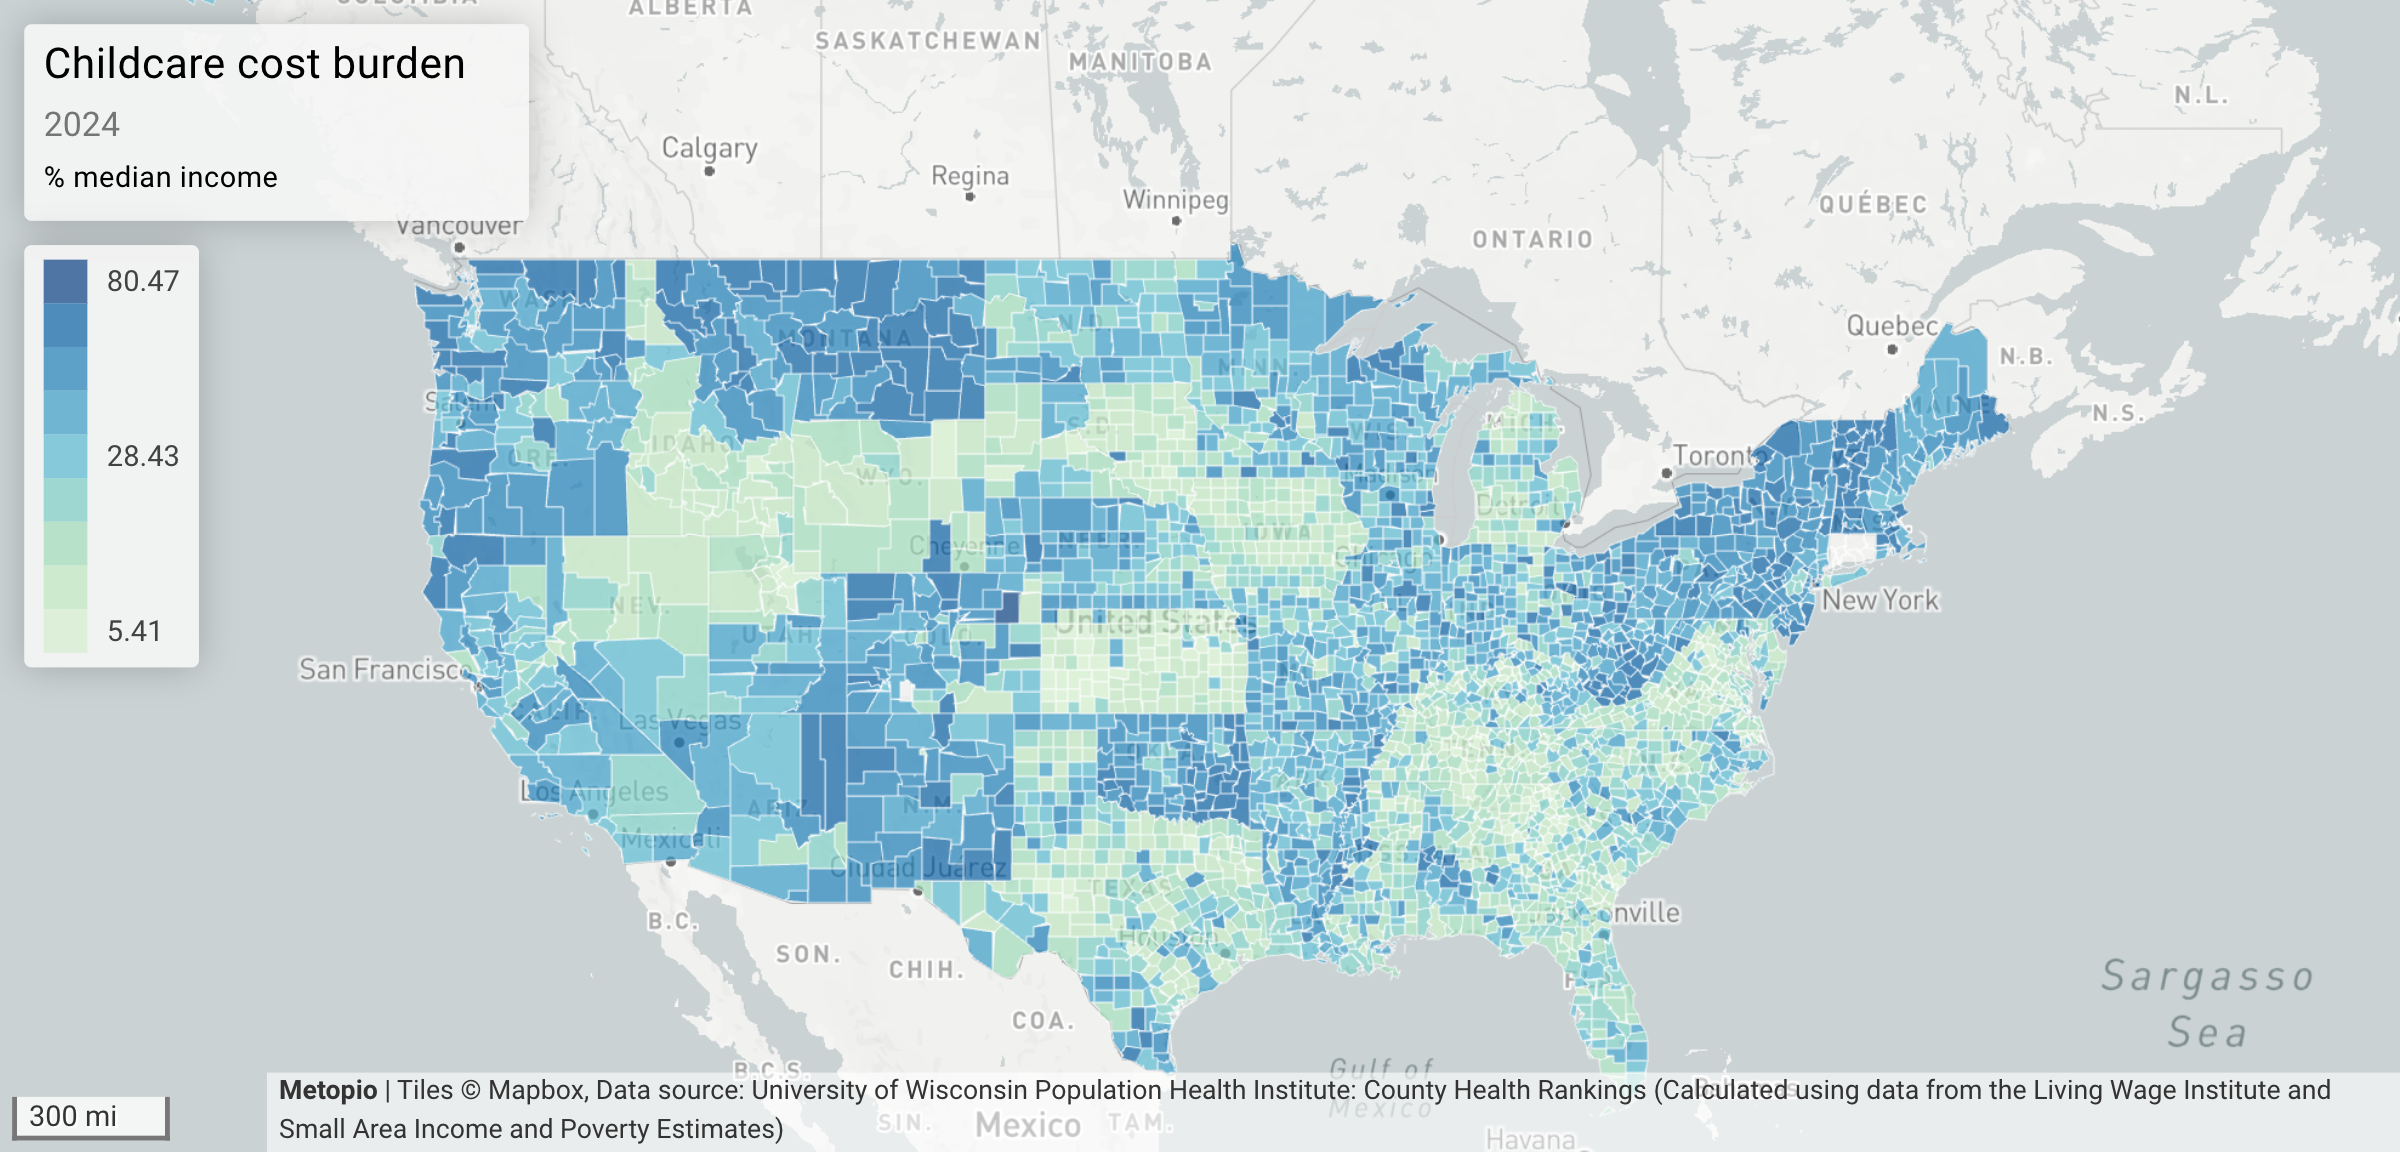
"When families hit these levels, they start to question: Is it worth it for me to work and bring in a second income, or is it better to try to scrape by on a single income?" Elliott says. "This kind of measure has real implications for what a family's doing."
The data comes from County Health Rankings and is based on the Living Wage Institute's estimated costs, ensuring it reflects local economic realities rather than national averages.
The Cost of Feeding a Family
Food costs add another layer to the true cost of living. Metopio tracks the cost per meal based on USDA's Thrifty Food Plan — the baseline for what constitutes an appropriate, affordable meal.
USDA has standards for what constitutes an appropriate amount of food for a person of different ages, different genders, and whether they're being thrifty or more spendy with their meals.
The map reveals predictable patterns — resort towns in Colorado, coastal areas — but also shows how food costs layer onto housing expenses.
When Elliott filtered for areas with low meal costs and lower housing costs, a clear pattern emerged: overall cost of living is lower in rural regions, while urban centers like Dallas, Fort Worth, and Houston show higher costs across the board.
When Older Adults Can't Make Ends Meet
One of the most important (and often overlooked) populations facing cost-of-living challenges is older adults. Metopio tracks severely cost-burdened older adult households (those over 62 spending more than 50% of their income on housing).
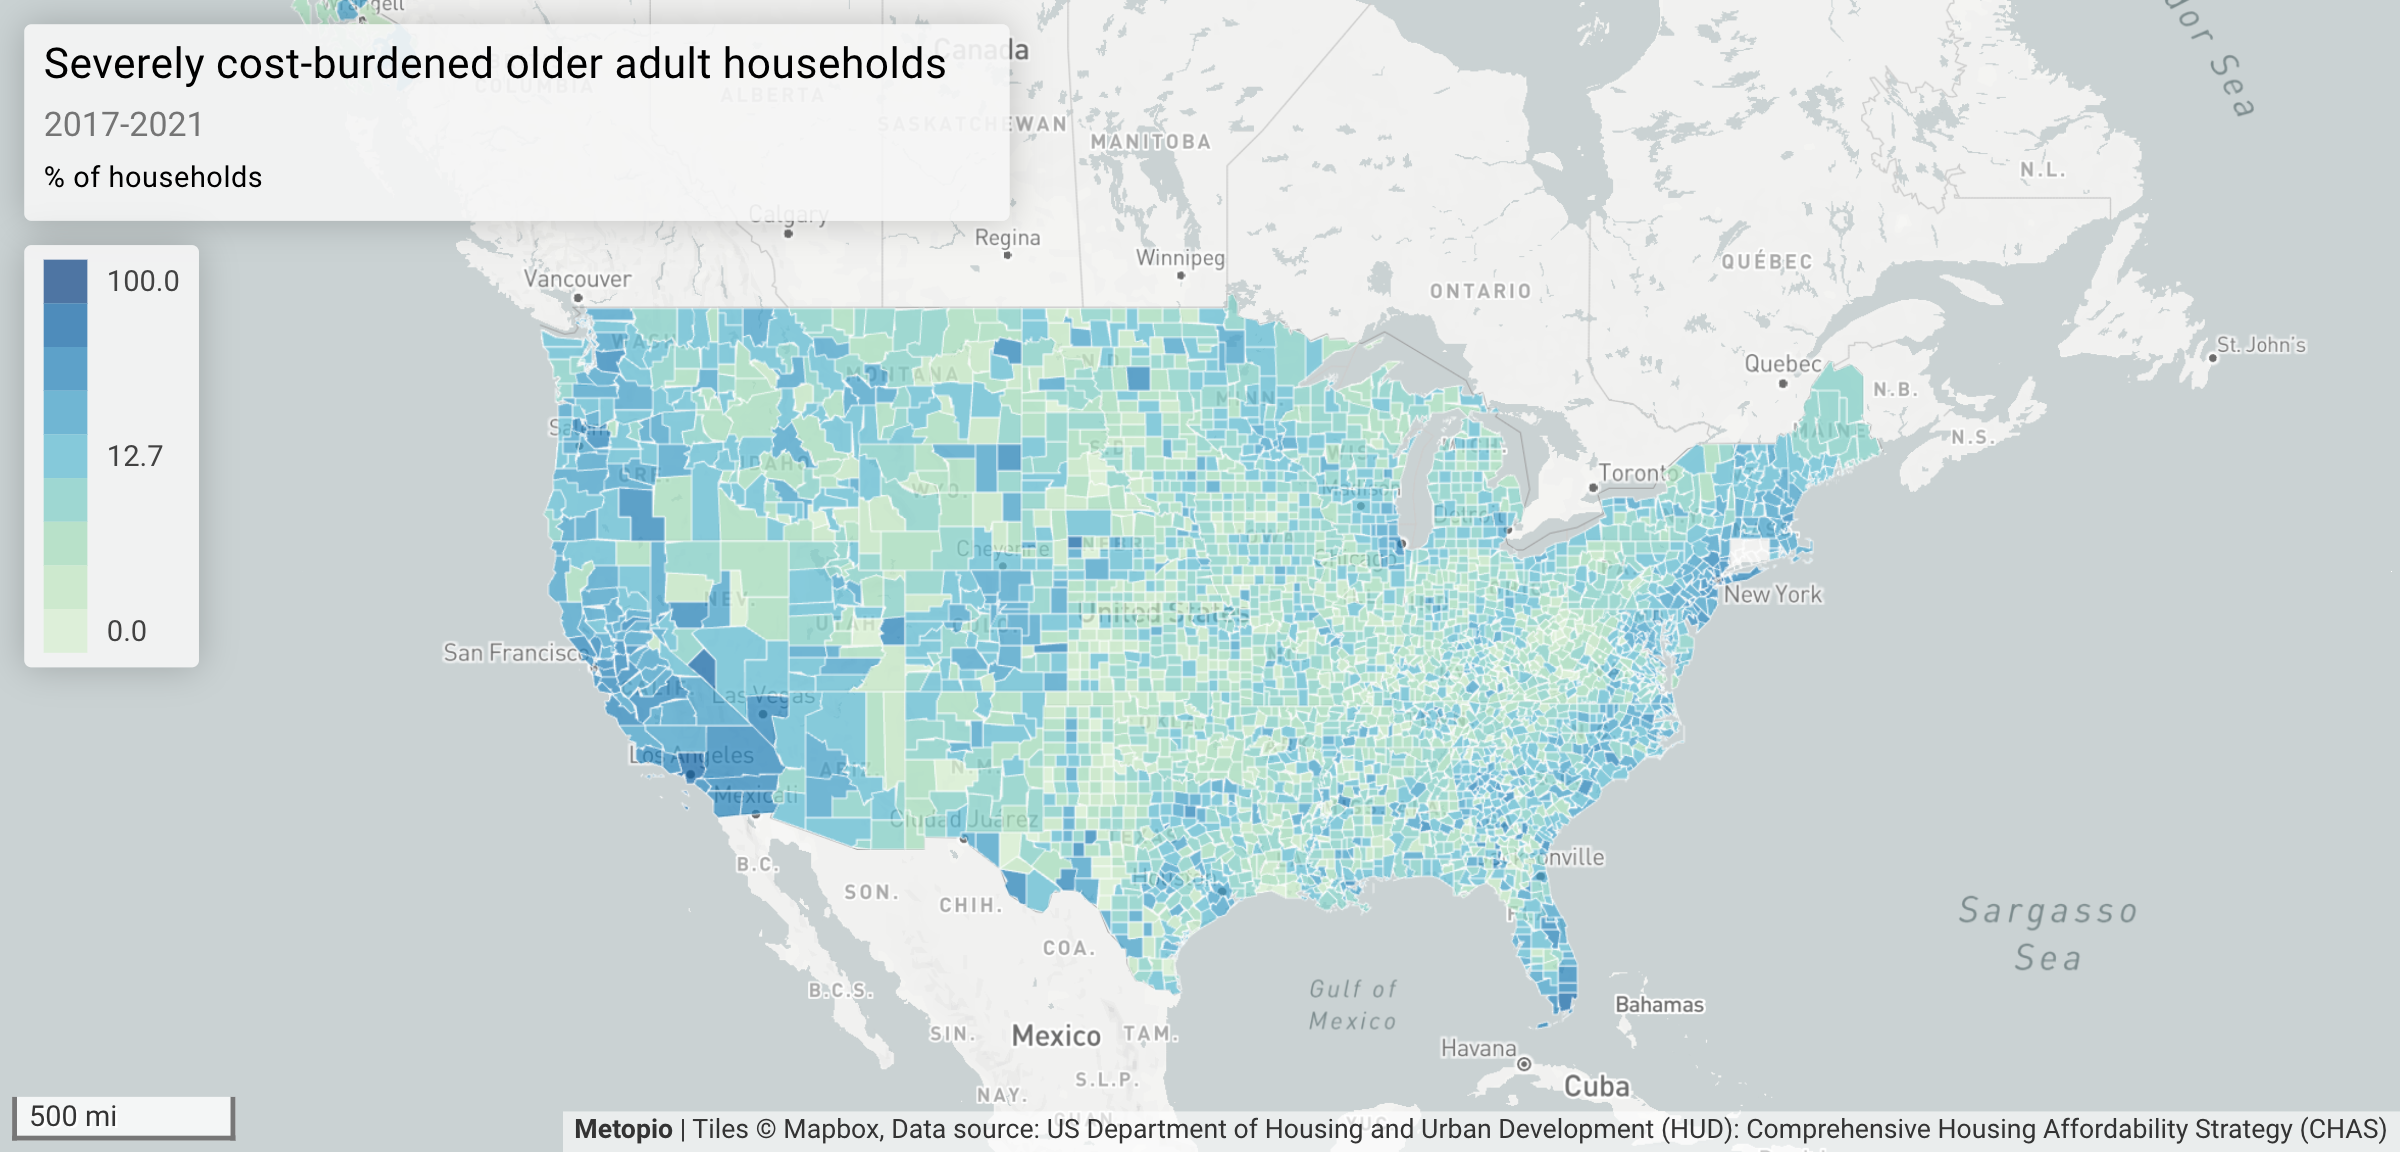
"We're looking at people who are maybe retired or approaching retirement," Blonsky explains. "We can't just tell them to get a better job. They're at the end of their working career, which means they're going to have to budget out for potentially quite a while on that relatively limited income."
In some counties, 20% or more of older adults are spending over half their income on housing alone — leaving little for food, medications, or healthcare.
"If they're spending half their income on housing, you know they have other monetary needs," Blonsky continues. "They may need expensive meds, they may have expensive secondary insurance. One hopes they're approaching the point where they have Medicare, but that still means there's a point of intervention here where older adults may have particular financial needs."
This specificity is what makes the indicator valuable. Instead of looking at county-wide averages, it focuses on a population that public health and hospital teams are often trying to serve.
““I like this topic because it’s so specific. We’re getting past those averages for the county and really saying: this is a population you might be addressing, with specific needs.” ”
Why Low-Income Housing Cost Burden Matters
Metopio also tracks housing cost burden specifically for low-income households — those earning 80% or less of the HUD Area Median Family Income (HAMFI). These households spending 30% or more of their income on housing face fundamentally different challenges than higher earners.
"Housing cost burden can be housing cost burden no matter how much you make," Blonsky acknowledges. "But when you're low-income, you have only so much left."
The comparison is stark: someone earning $400,000 annually who spends 30% on their mortgage still has substantial resources. But a low-income household spending the same percentage has far less left for food, transportation, healthcare, and emergencies.
Using HUD's local definitions rather than federal guidelines ensures the data reflects actual community economic conditions — critical for fair analysis and targeted intervention.
Urban Versus Rural: Different Challenges, Different Solutions
As Elliott and Blonsky explored Texas counties, a pattern emerged: urban centers show the highest concentrations of low-income households facing severe cost burden.
"Here's where we were looking at the lower cost of living, the lower food costs," Blonsky says, pointing to rural areas. "Now we're seeing the opposite. A lot of those cities have higher rents, but also plenty of people with lower incomes."

This urban-rural divide means interventions can't be one-size-fits-all. Rural communities may need transportation solutions and grocery access, while urban areas require affordable housing development and rent assistance programs.
Moving Beyond Averages
The true cost of living isn't captured by a single number or a national benchmark. It's revealed through layered analysis of housing, childcare, food costs, and income — all measured at the local level where people actually live.
"These topics really display the true cost of living," Elliott emphasizes. "When clients tell us they know their community members are struggling, this is the data that confirms what they're seeing and helps them understand why."
For public health departments, hospitals, and community organizations, this granular data transforms anecdotal observations into actionable evidence. It shows where interventions are needed most and what kind of support would make the biggest difference.
Because when it comes to economic hardship, context isn't just helpful — it's everything.