
THE PLATFORM
One Platform for the Full Community Health Cycle
Metopio unifies the data, assessment, planning, and reporting that community health work requires — replacing the spreadsheets, consultants, and disconnected dashboards teams have used for decades.
One Data Foundation, Built with Curated Data and Your Own
Identify and understand health needs in days, not months
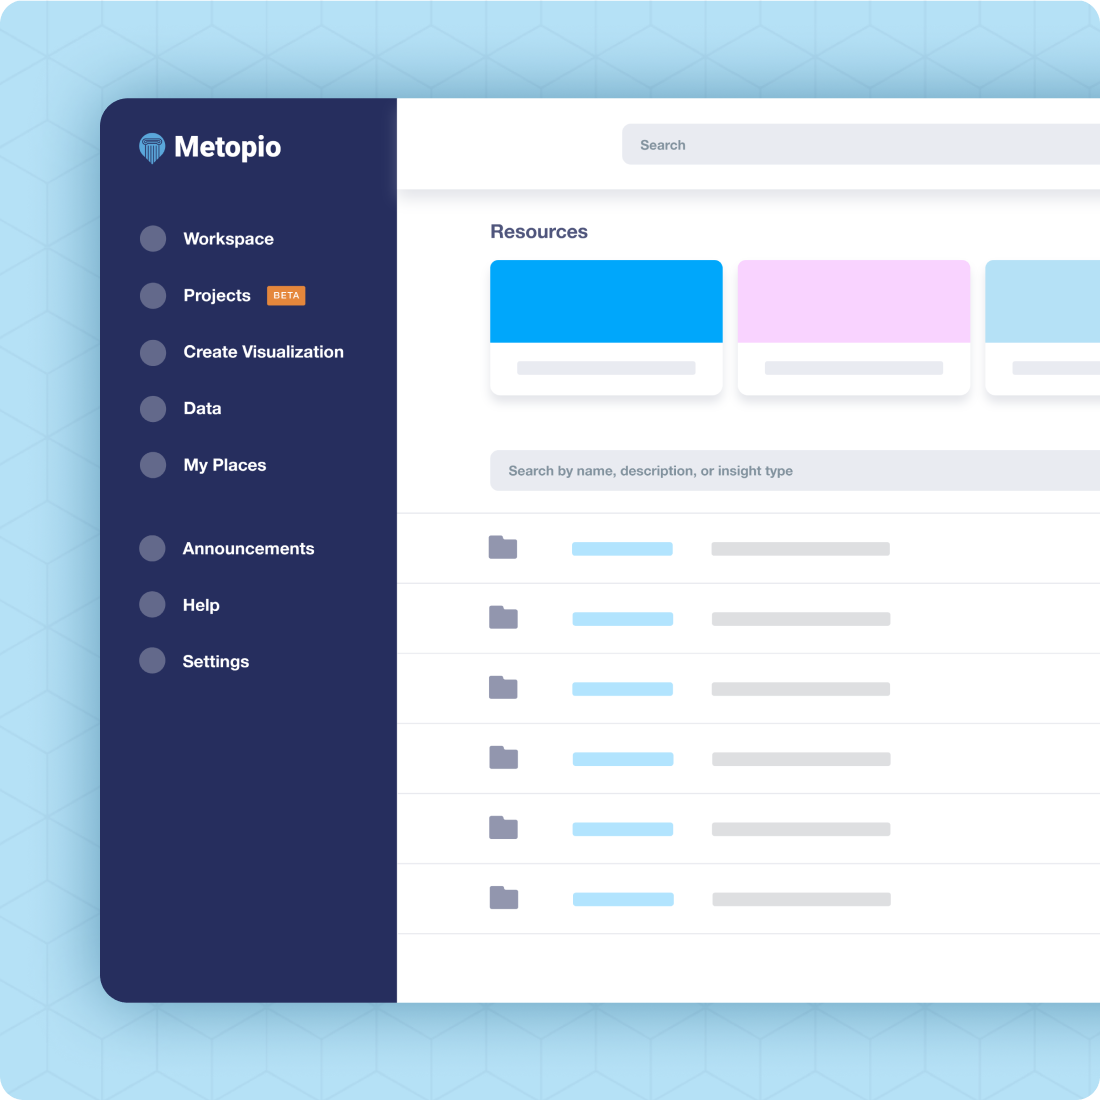
Metopio curates hundreds of millions of data points from 500+ federal, state, and local sources covering 100% of U.S. communities, down to the census tract wherever the source allows it and carrying full technical documentation.
Organizations can also bring in their own claims data, EHR extracts, program data, or survey results — kept private to the organization, while shared public data updates automatically at the source.
500+ sources, millions of data points, 100% U.S. community coverage
Full source documentation on every indicator — table, time period, stratification
Bring your own data; it stays private while public data updates automatically
Your Next Assessment, From Months to Days with Better Insights
Secondary data collection for an assessment takes weeks of staff time — sometimes months. Metopio generates that same (or often better) secondary data analysis in minutes, benchmarked against national, state, or peer data, as soon as a service area is defined.
The platform tracks against PHAB standards, MAPP 2.0 guidance, and other requirements while the assessment is being built, so what's fulfilled and what's outstanding is visible before submission, not after.
Cuts assessment timelines from 9–12 months to days
Trained on thousands of completed assessments — fully editable, never locked to a default
Tracks accreditation and reporting requirements in real time, before submission
From Assessment to Accountability
Identify and understand health needs in days, not months
An assessment creates impact when it drives the plan that follows. With Metopio, priorities identified in the assessment carry directly into the next stage — same platform, same login.
Building the plan doesn't start from a blank page either. Teams can pull directly from Metopio’s library of nearly 500 validated programs, matched to the priorities just identified — plus more than 300 come with pre-built evaluation frameworks already attached, so the metric, target structure, and measurement cadence are ready on day one.
Priorities carry directly from assessment to plan — no re-entry, no second dataset.
Nearly 500 validated programs; 300+ with evaluation frameworks pre-built.
One methodology and one set of standards, with local priorities intact underneath.
Track What You Planned, and Act the Moment It Slips
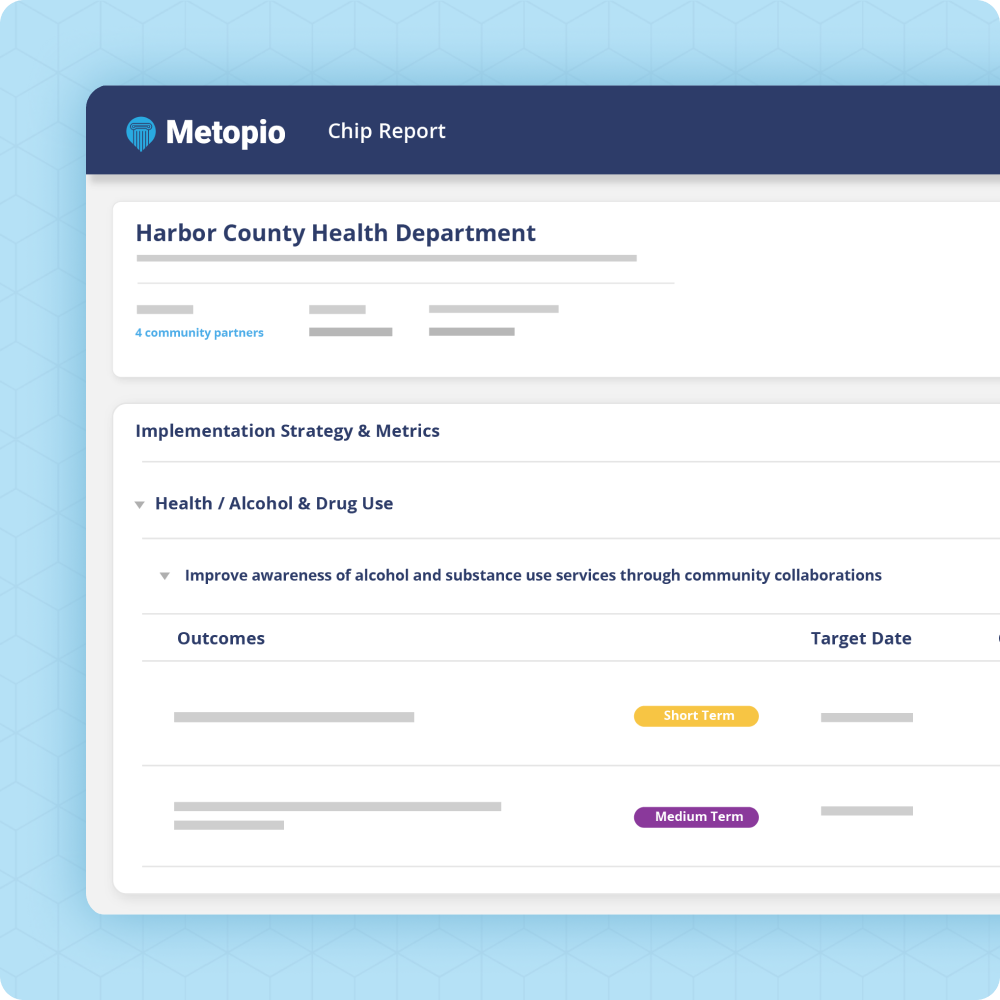
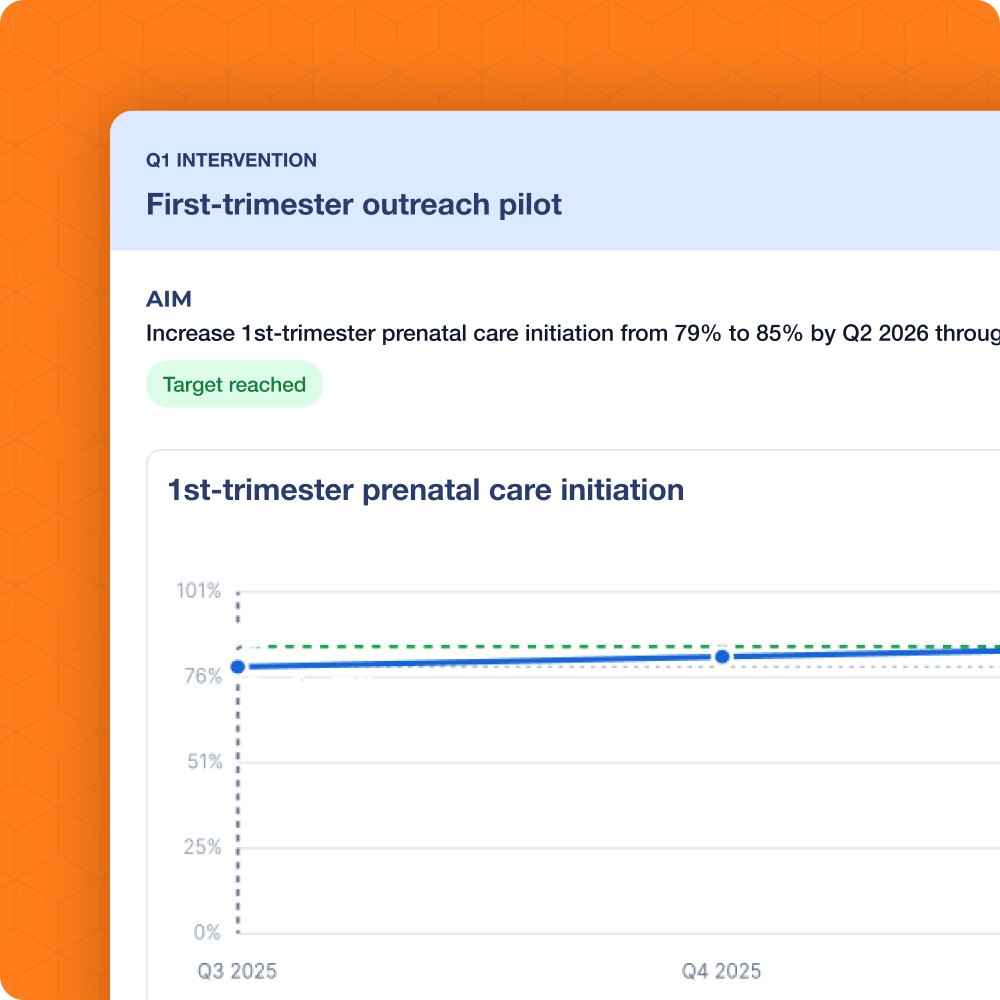
Every program gets a measurable target and an owner. When a metric falls behind threshold, Metopio flags it (and prompts a quality improvement plan if needed).
The strategic plan, improvement plan, and compliance reporting typically track the same underlying investments in disconnected places. Here, they're linked. Update a measure once, and the programs, plans, dashboards, and reports that depend on it stay aligned — from internal performance reviews to board and funder reporting.
Real-time tracking against target, baseline, and threshold for every program.
Automatic quality improvement plan prompts when performance underperforms.
One update reflects across the strategic plan, the improvement plan, and every report tied to it, including board and funder updates.
Bring Your Own Data, Including Surveys
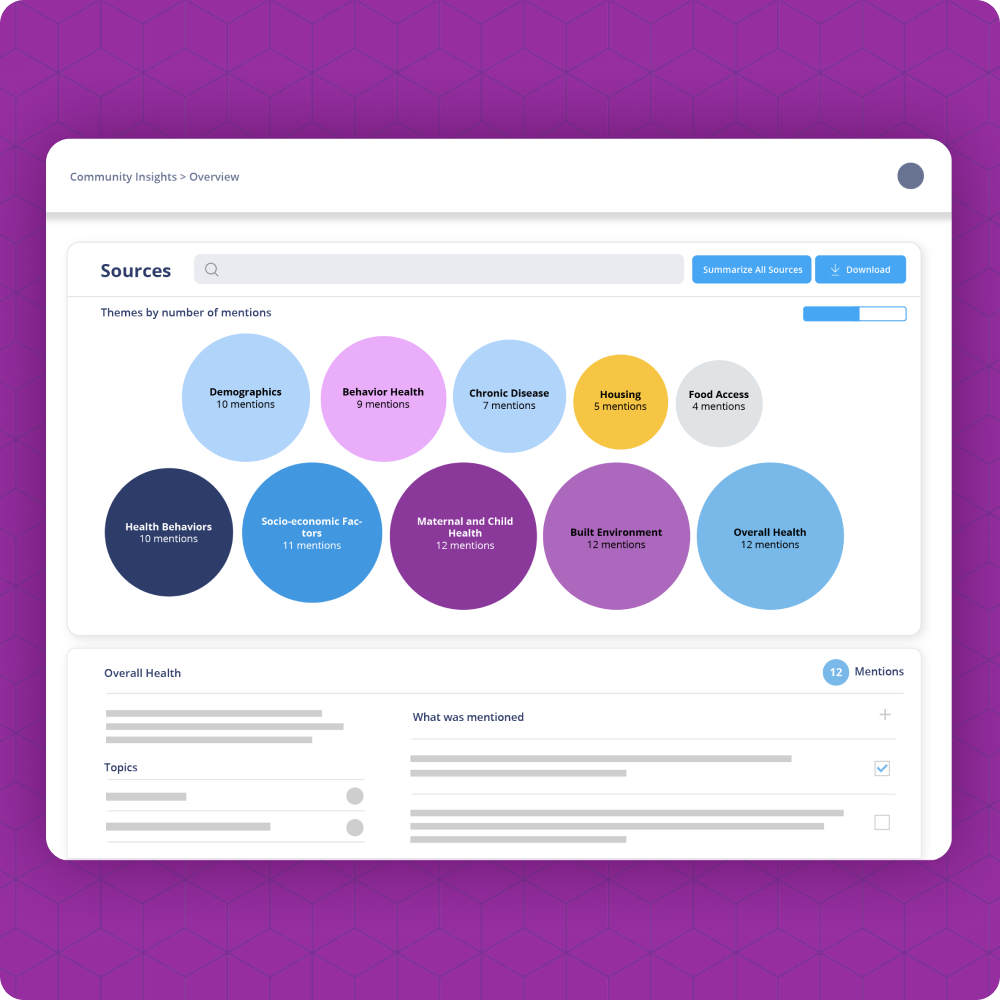
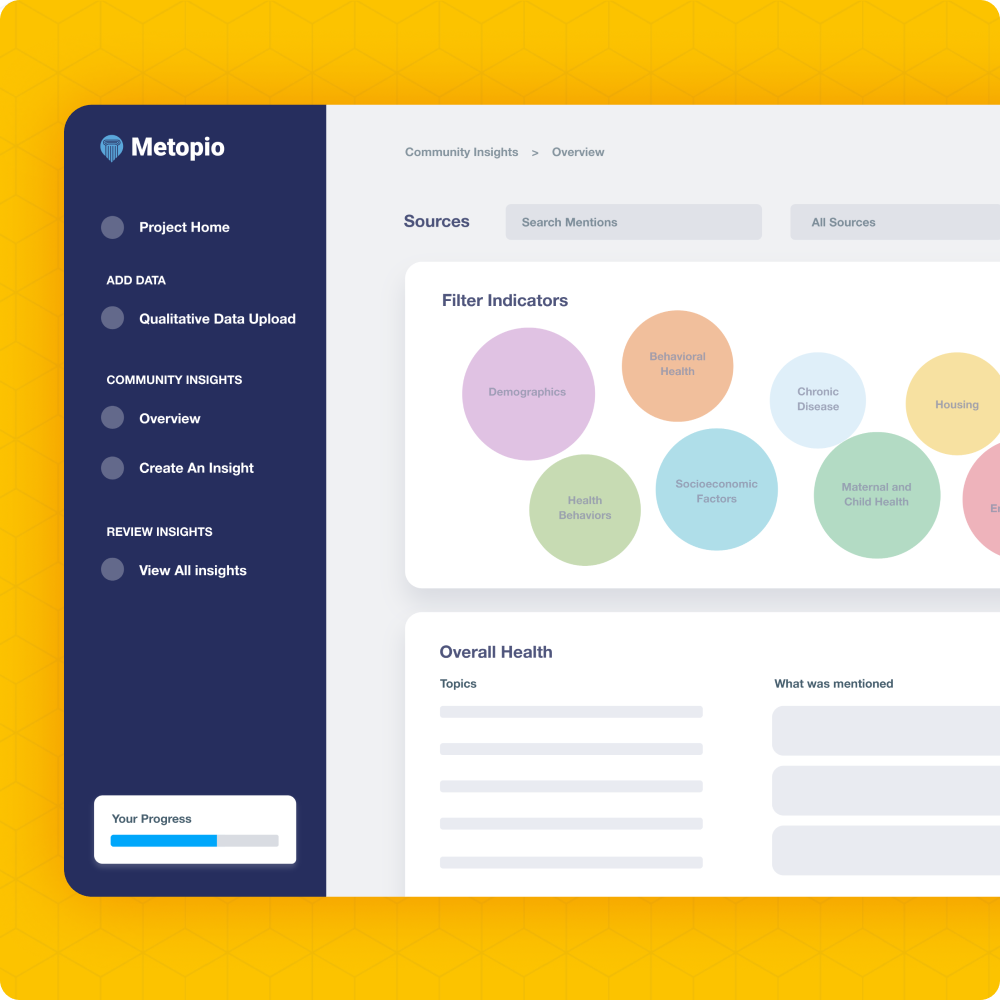
Metopio supports survey builds and collection, backed by the platform's own data standards work. Qualitative input — focus group transcripts, unstructured notes, open-ended survey responses, listening sessions — is organized into themes with sourced quotes, ready to drop into a report section.
Build from our question bank and track survey responses directly in the platform.
Cluster qualitative responses into themes with sentiment and sourced, traceable quotes.
Combine survey results with curated public data in the same view to uncover cross-cutting issues.
A Public-Facing Home for the Data Behind Your Priorities
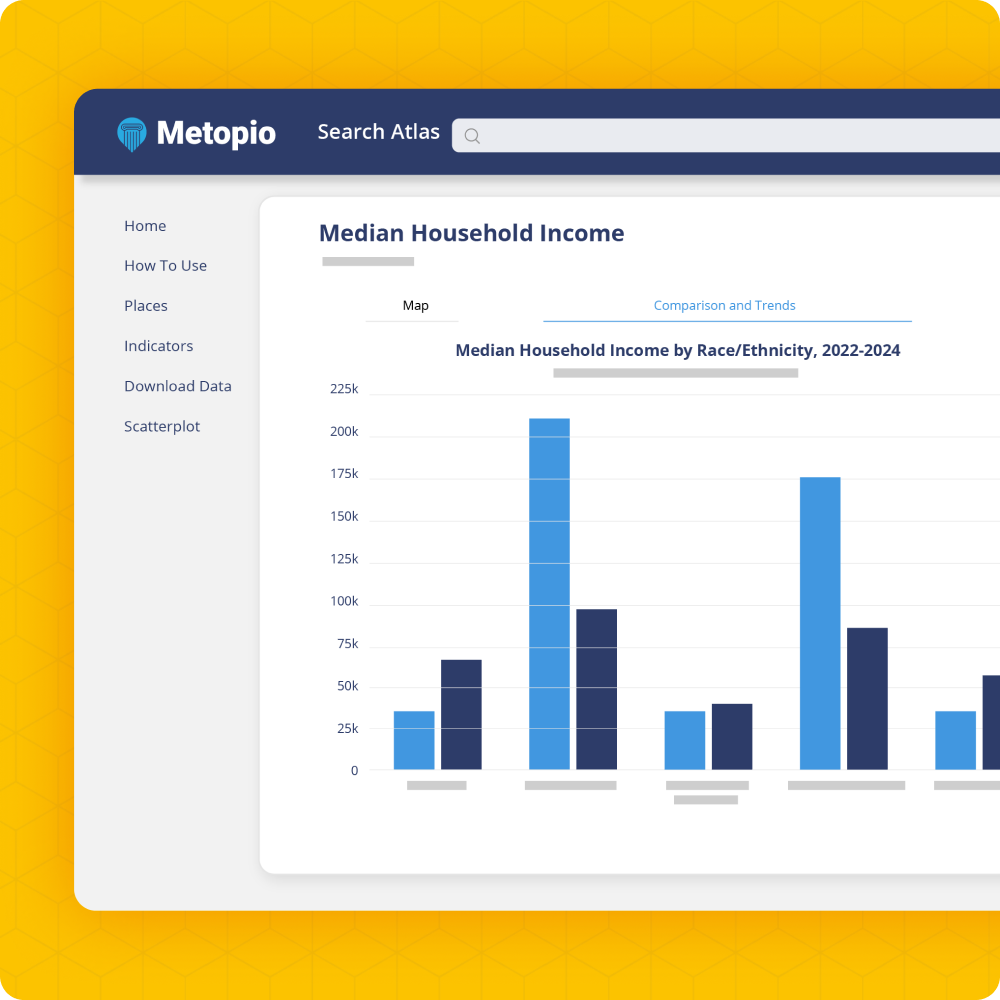
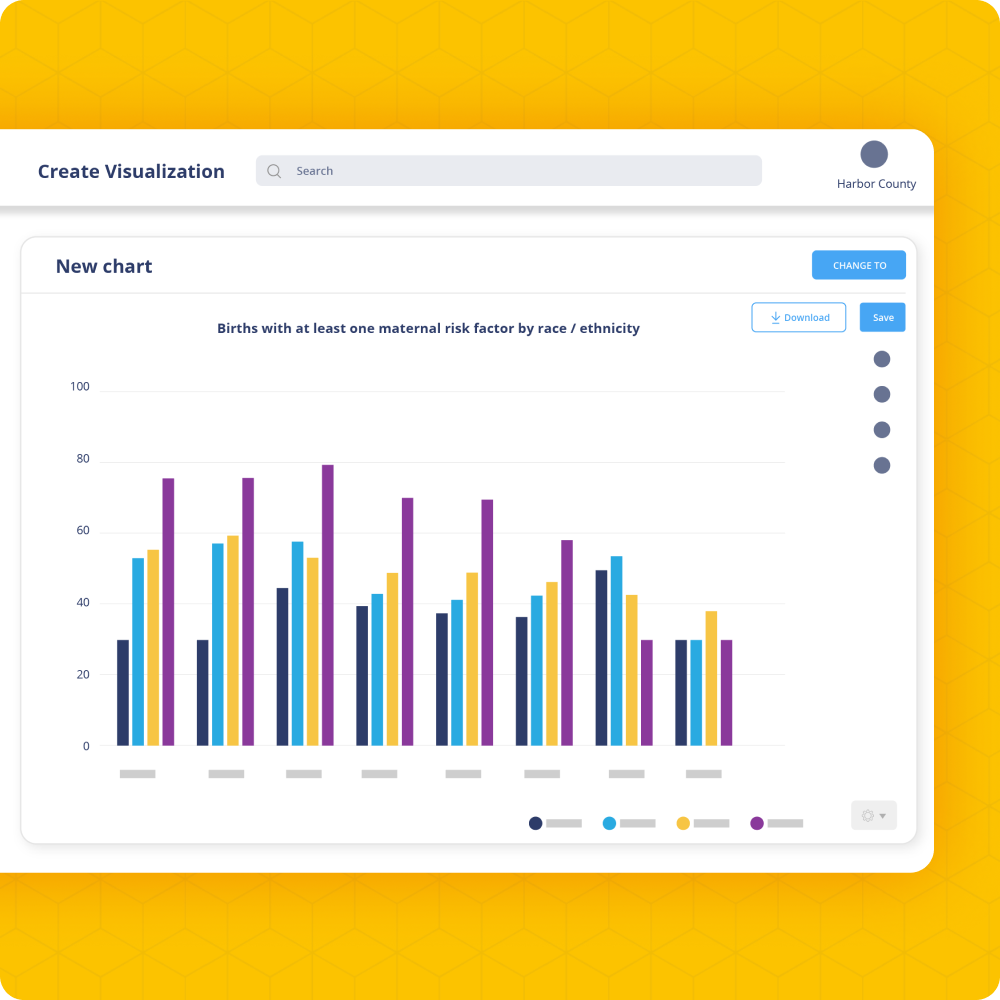
The Atlas is a branded, web-based dashboard a community, board, or funder can explore directly — with no IT lift required to stand it up. It publishes the story behind your community's needs (not just the numbers), explaining why a disparity exists and what's being done about it. Best of all, your community can pull the same data directly instead of filing a request.
Branded, public-facing, no IT lift to launch.
Publishes narrative context alongside the data, not just the numbers.
Continuously updated at the source.

AI Does the First Pass. The Judgment Calls Stay with Your Team.
Metopio's AI never touches the underlying data — it doesn't weight or interpret findings. It does organize: pulling secondary data into the right structure, summarizing qualitative input into themes and quotes, and drafting narrative sections in an organization's existing tone when a past report has been uploaded. The judgment (what matters for your community) stays with the analysts and epidemiologists doing the work.
Every AI-assisted statement links back to an underlying data or transcript passage. All data is de-identified and stored securely in your workspace; Metopio's AI never interacts with protected health information. Every AI-generated narrative can be reviewed and approved by your team before it becomes part of an assessment, plan, or report.
Human-in-the-loop by design — you review every AI narrative before publishing.
De-identified, secure by default; no interaction with protected health information.
Every output includes source links and version history.
What Our Customers Say
-
![Photo of Shivonne Laird]()
"Has been a great resource for our community health team and partners, and we have barely scratched the surface in using all the tools it offers."
– Shivonne Laird, Bon Secours Health System
-
![Photo of Shannon Jermal]()
"Metopio is a valuable community data tool that is easy to use and really saves time."
– Shannon Jermal, Ascension Health
-
![Photo of Mervin Dino]()
“Metopio is a forward-thinking technology developer that has enabled us to rethink how we wield data for action to improve the health of our communities in Chicago."
- Mervin Dino MPH, City of Chicago
-
![Photo of Erika Ninos]()
"I find Metopio to be a tremendous resource in my work. The interface is very easy to work in and the customer service is top notch!"
- Erika Ninos, Advocate Aurora Health
-
![Photo of Nik Prachand]()
“Our data strategy is focused on transparency, accountability, and accessibility. I’m proud that the Chicago Health Atlas is the primary vehicle for achieving those goals.”
- Nik Prachand, Director of Epidemiology, Chicago Department of Public Health


